Is your cargo stuck at a congested port? Are clients threatening penalties for late deliveries? Does your factory face shutdowns waiting for components? If these sound familiar, your choice between air and ocean freight isn’t just about cost – it directly impacts cash flow, customer trust, and operational survival. Let’s cut through the marketing fluff. The Brutal Truth About Transit Times (Shanghai to Los Angeles 2024 Example) Air Cargo: Transit: 3-5 Days Customs Clearance: 1-2 Days (Priority Channels) Risk of Major Delay: Low (<10%) Ocean Freight: Transit: 18-30+ Days Customs Clearance: 3-7+ Days (Standard Processing) Risk of Major Delay: High (>35%) Why “30 Days” for Sea Shipping Often Means 45+ Days: Port Congestion: Major hubs like Rotterdam (Europe) or Long Beach (US) routinely add 7-14 days. Missed Sailings: Your container misses its intended vessel slot. Customs Inspections: Physical container examinations add weeks, not days. Cost Reality: It’s NOT Just the Base Rate The Hidden Cost Trap of Sea Freight: Real Ocean Cost = Base Rate + THC (Terminal Handling) + BAF (Fuel Surcharge) + Customs Bonds + Demurrage/Detention Fees. Example: A shipment quoted at $1,200 can easily cost $2,800+ due to: BAF surcharges fluctuating to $950+ THC fees of $350+ Demurrage/Detention fees of $300+ per week if containers aren’t returned or cargo isn’t picked up fast enough. Air Freight Cost Transparency: Real Air Cost = Base Rate + Security Surcharge + Customs Clearance Fee. No hidden port terminal fees. This predictability is crucial. When Air Freight ACTUALLY Saves You Money: Perishable or Short-Shelf-Life Goods: Seafood exports losing 12% value per day delayed. Electronics with a 90-day market window becoming obsolete or discounted. Avoiding Contract Penalties: Manufacturing contracts often levy $5,000+ per day for late delivery.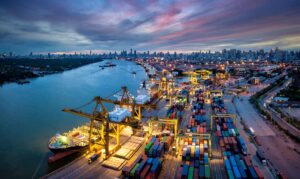 Critical Cash Flow Needs: Air shipments get invoices paid 25+ days faster than sea freight, improving working capital. When Sea Freight Makes Sense (The 3 Real Scenarios): High-Volume, Non-Urgent Shipments (Typically >10 CBM): Raw materials, bulk furniture, seasonal stock with long lead times. Predictable, Stable Supply Chains: Goods with a confirmed 6+ month sales window. Extremely Cost-Sensitive Commodities: Steel, grain, construction materials where pennies per kg matter. The Smart Shipper’s Hybrid Strategy (Real Example): “Port Hopping” Route: China -> Air Freight to Dubai Hub (3 days) -> Sea Freight to Europe . Cost: 40% cheaper than full air. Time: 12 days faster than full sea via congested European ports. Used By: UK fashion retailers avoiding Felixstowe port delays. Customs Red Flags (Industry Insider Warning) Why Sea Shipments Get Stuck: Incorrect HS Codes (Commodity Classification). Container weight discrepancies (VGM errors). Mandatory agricultural inspections (e.g., USDA holds). Why Air Cargo Clears Faster: Trusted Trader Programs (e.g., CTPAT, AEO) enable expedited clearance. Major airports have dedicated, faster customs lanes for air freight. Your Decision Checklist: Choose Air Freight If: Goods Value > $100/kg Cost of 1-Day Delay > $3,000 Shipment Volume < 2 CBM Choose Sea Shipping If: Time Sensitivity is Low (>45 day buffer) Cost/kg Target < $1.50 You have a 50% time buffer beyond the carrier’s estimate The #1 Importer Mistake We Fix: Using sea freight for: Marketing campaign materials (e.g., pre-event brochures). Trade show samples.
 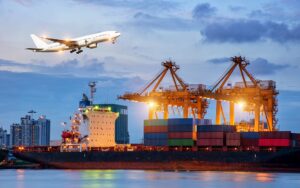 Urgent machine replacement parts. Result: A client lost a $27,000 order waiting for sea freight. Air was the profitable choice. Need an Accurate Quote NOW? Click for Real-Time Air vs Sea Cost Calculator] (https://www.yourlogistics.com/air-vs-sea-calculator ) Enter dimensions/weight → Compare total costs including LIVE 2024 surcharges. Got an Urgent Shipment? Contact Us:WhatsApp :+86 15999718863 Guaranteed air freight space confirmation within 4 hours. Why Getting This Right Matters NOW: Post-Red Sea crisis, sea freight reliability has plummeted while air cargo capacity has increased by 17% (IATA Q2 2024). Protect your profit margins by choosing the right mode. (Sources: Drewry Maritime Research 2024, IATA Air Cargo Market Analysis Q2 2024, U.S. CBP Delay Statistics)
0 Comments
1 category